If you choose Erlang B for the new analysis report and you click on the Preview tab, the following Erlang B graph tab options will be made available for all Erlang B reports based on the choices derived from the fields and constraints tabs:
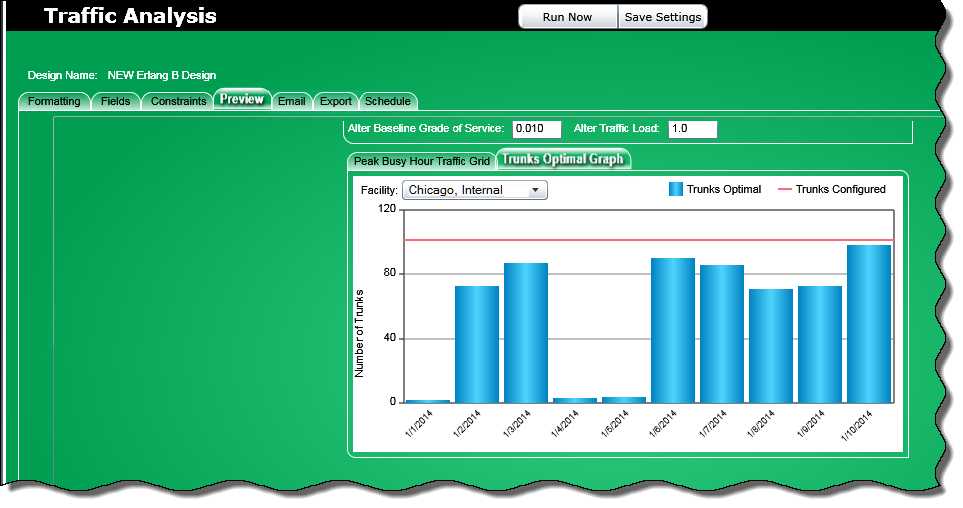
Trunks Optimal Graph
This option requires the following fields to be selected from the fields and constraints tabs:
Note: The Trunks Optimal Graph tab will not be made available until the following required fields have been chosen:
An example of a trunks optimal graph is as shown below:
Note: In order to get accurate report results for the Trunks Optimal Graph the Peak Busy Hour field is also required (example as shown below):
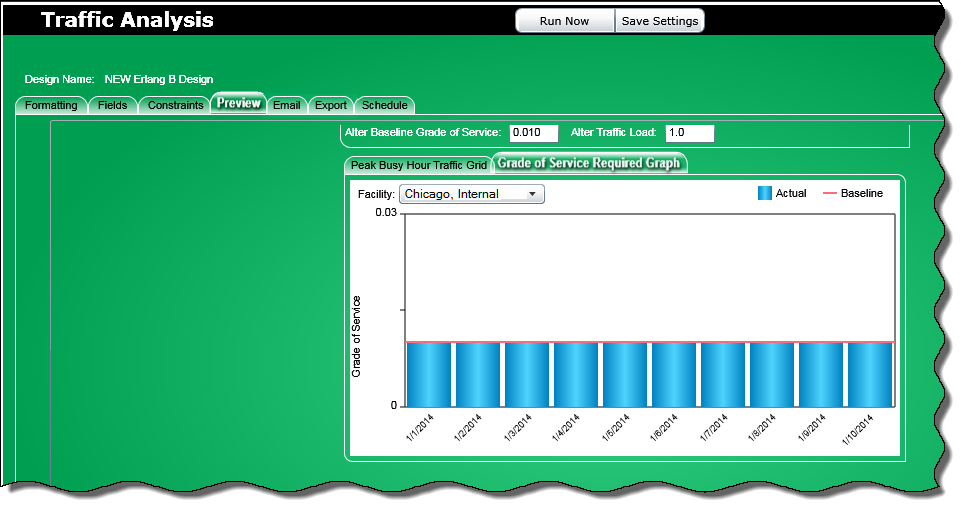
Grade of Service Required Graph
This option requires the following fields to be selected from the fields and constraints tabs:
Note: The Grade of Service Graph tab will not be made available until the following required fields have been chosen:
An example of a grade of service graph is as shown below: