This quick start guide provides general information for the Traffic Analysis feature.
Note:Examples of user case scenarios that utilize the Traffic Analysis application are described in the Use Cases section of this guide.
The Traffic Analysis tool allows customers to accurately analyze and forecast their call traffic based on actual data. A company’s network configuration can have a significant impact on their profitability. If a company is paying for more lines or bandwidth than they are using, it is a waste of resources. Conversely, if there are fewer lines or bandwidth than is needed, customers will get a busy signal, possibly resulting in lost revenue. The new Traffic Analysis tool will assist customers in determining the correct balance of lines and bandwidth based on their actual call traffic data.
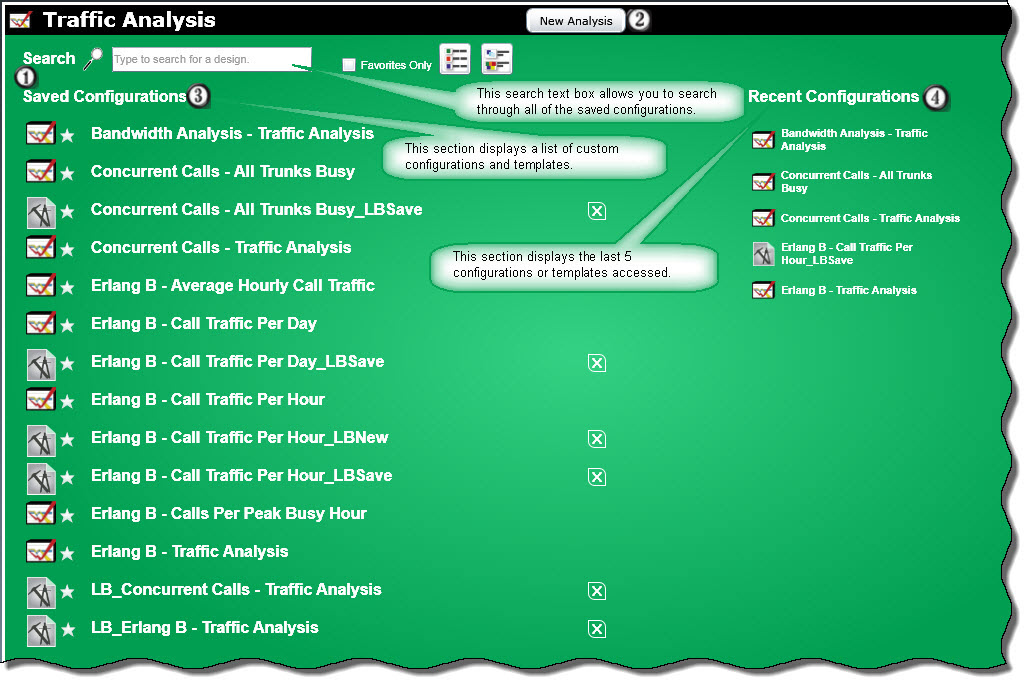
After selecting Traffic Analysis from the Reports/Export menu, the following Traffic Analysis main screen will be displayed.
1 At the top of the screen are controls that let you limit what is displayed. There is a Search text box where you can search for reports and a Favorites Only check box that lets you display just favorite reports.
2 The top of the page has a button labeled "New Analysis". This feature allows the user to create new traffic analysis designs by specifying which fields and constraints to include in the reports. Clicking this button will allow a user to create reports based upon the following:
Bandwidth Analysis
Bandwidth analysis is used to calculate the data transfer speed required based on peak concurrent calls. This report can also be used as a forecasting tool to predict how much bandwidth will be needed, for example, to move from a traditional architecture to a SIP environment.
Concurrent Calls
The concurrent calls functionality provides an interactive tool to display gateways/trunks available based on the system configuration, current gateway/trunk usage based on actual call traffic, and can also provide information on usage at peak busy hour. Peak concurrent calls information is the greatest number of calls that occurred at the same time for the given time period. Also provided is the duration at peak.
Erlang B
Erlang B is a network modeling formula typically used to determine the probability of call loss on a group of gateways/trunks. The Traffic Analysis tool uses the Erlang B calculation to determine the number of trunks needed to handle a calling load during a given period. The formula uses the actual call traffic durations, call counts, and the traffic load factor to determine the busy hour traffic. It also then uses this information and the Grade of Service to determine the trunks optimal for the network.
3 On the left-hand side of the screen is a section that contains Traffic Analysis Templates and saved configurations. Templates provide a quick start for familiarizing a user with the Traffic Analysis application. They may be utilized as is to generate reports or may be used as a starting point to create custom reports. To access a report or template simply click on the name. The following report templates are available:
Bandwidth Analysis - Traffic Analysis Report
Bandwidth analysis is used to calculate the data transfer speed required based on peak concurrent calls. This feature will first determine the greatest number of concurrent calls for the given time period.
Using the concurrent calls total, the user-specified information such as the codec, and the bandwidth formula, the correct bandwidth requirements will be determined.
The user may specify the constraints for specific traffic to be moved. The Traffic Analysis system will correctly group the information from all the sources specified and provide an estimate of total bandwidth required.
Concurrent Calls - All Trunks Busy
The All Trunks Busy report is used to provide a total of how many times per day all trunks were in use at the same time. For multiple occurrences in a day, the report shows how many times this condition occurred and the first and last time it occurred. The report also contains information on the total duration, the average duration, and the longest duration of all occurrences. When an “All Trunks Busy” condition is encountered, no additional calls can be received at that time and no calls can be made at this time. Running this report at scheduled intervals provides information as to whether a company is over or under trunked allowing them to make informed network decisions.
Concurrent Calls - Traffic Analysis
The Traffic Analysis report is used to provide the busiest hour of the day for each day in the chosen date range. It may be used for monitoring the current network and forecasting network requirements using actual data. The peak concurrent calls values provided in this report will quickly show if adequate trunks are available or if that number is approaching the existing trunk amount and how often. When attempting to consolidate trunks, the Concurrent Calls report will meet forecasting needs by allowing the combination of data from multiple sources such as various facilities to provide the maximum number of calls made at the same time resulting in the number of trunks needed to handle the combined call volume. The report also shows the number of peak concurrent calls during the busiest hour and the duration at peak.
Erlang B - Average Hourly Call Traffic
This is a summary report that provides averages of call traffic activity over the specified date range for each of the 24 hours. The report includes total and average call durations, total call count, the average percent of capacity consumed, trunks configured, and average trunks optimal. The average trunks optimal are calculated using the Erlang B formula and actual call data.
Erlang B - Calls Per Peak Busy Hour Report.
This report is used to determine whether the organization is over or under trunked.
For the given time period, it determines the busiest hour of each day, how many trunks were available, and the number of trunks required to handle the traffic at a grade-of-service level determined by the user.
The Calls Per Peak Busy Hour report provides information on the peak busy hour, total count and duration, the trunks configured for the system, and the trunks optimal.
Erlang B - Call Traffic Per Day
This report provides information on call traffic activity for each day in the date range. It determines for each day the total and average duration of calls, the total number of calls, and average number of calls per hour. Using this information and the number of trunks available, the percentage of trunk capacity being consumed is calculated.
Erlang B - Call Traffic Per Hour
The Traffic Analysis report is used to provide the busiest hour of the day for each day in the chosen date range. It may be used for monitoring the current network and forecasting network requirements using actual data. The peak concurrent calls values provided in this report will quickly show if adequate trunks are available or if that number is approaching the existing trunk amount and how often. When attempting to consolidate trunks, the Concurrent Calls report will meet forecasting needs by allowing the combination of data from multiple sources such as various facilities to provide the maximum number of calls made at the same time resulting in the number of trunks needed to handle the combined call volume. The report also shows the number of peak concurrent calls during the busiest hour and the duration at peak.
Erlang B - Traffic Analysis
The report provides traffic analytics that include the busiest hour of the day, call types, total counts for inbound, outbound, and other calls, occurrences of no trunks available, occurrences of equipment failures, the trunks configured for the system, trunks optimal, and the amount of trunks over or under the optimal number.
The Erlang B calculation is used to determine the trunks optimal based on actual call activity for the given date range.
4 The Recent Reports section displays the last 5 reports or templates accessed by the current user.
Note: The main menu has a dynamic search box, icons to toggle between a short description view or a detailed view and a pair of icons for the help topics and to close the window.
There are seven tabs available.
Formatting - The date and duration formats are selected here as well as the design options (format, orientation, font and font size)
Fields - The headers and columns are selected and properties are specified under this tab. A complete list of all of the options that available as described below.
Constraints - The filters, date range and time zone are selected under this tab.
Note: Enabling the AND/OR Constraints feature will allow the report creator to group the constraints with an AND/OR clause. The default settings link all of the constraints with the AND clause. This leads to each constraint filtering out more data. Using the OR clause will add more data to the final report. This feature will allow the report creator to group the constraints with an AND/OR clause.
Preview - Clicking on this tab will bring up a table view of the report.
Email - Used for configuring the email or Report Portal delivery settings.
Export - Used for configuring the export delivery settings for saving the report to a file.
Schedule - Allows the user to create, edit, or delete a report schedule.
Field |
Description |
Header or Column? |
Available in Design Type |
||
Erlang B |
Concurrent Calls |
Bandwidth Analysis |
|||
<Spacer> |
Adds a space in the report layout |
Column |
X |
X |
X |
Additional Overhead |
This refers to an option whereby the calculated bandwidth can be increased by a certain percentage. A multiplier used to calculate the amount of overhead can be modified by editing the field. The default is 5%. |
Column |
X |
||
Bandwidth |
The amount of calculated bandwidth required in megabits (mbps). |
Column |
X |
||
Busy Hour Traffic |
This refers to the number of hours of call traffic during the peak busy hour and shows the maximum traffic load that the network must support. Selecting this field will automatically include the Peak Busy Hour field. |
Column |
X |
||
Call Count |
Contains the number of calls. It can be modified to display the call total, average by date or average by hour. |
Column |
X |
X |
X |
Data Source Name |
Displays the name of the Data Source. Each source of data, e.g. PBX, data feed, etc. has a name. |
Both |
X |
X |
X |
Date |
Displays the date on which the calls occurred. |
Both |
X |
X |
X |
Day of Week |
Displays which day of the week the call(s) are from. It uses a three character abbreviation for the day of the week (e.g. Mon.) |
Column |
X |
X |
X |
Device Type |
Displays the type of device used. |
Both |
X |
X |
|
Duration |
Displays the amount of time consumed by calls. It can be modified to display the duration total, average by date or average by hour. |
Column |
X |
X |
X |
Extension Location |
This refers to the grouping of extensions into physical locations. This is the extension location to which the extension on an outbound call, inbound call, or the originator of an internal call belongs. |
Both |
X |
X |
|
Facility Name |
Displays the name of the Facility |
Both |
X |
X |
X |
First Occurrence |
This refers to the time of the first occurrence of peak concurrent calls. |
Column |
X |
X |
|
Grade of Service |
Shows the probability of a call being blocked for a given traffic load for a specific number of available trunks. It can be modified to show the actual or baseline grade of service. This field is altered in the What If section under the preview tab. The default grade of service is 0.01 which indicates that the blocking probability is 1 in 100 calls. |
Column |
X |
||
Hour of Day |
Displays the hour of the day for the group of calls. |
Column |
X |
||
Inbound Calls |
Displays the number of Inbound Calls |
Column |
X |
||
Internal Calls |
Displays the number of Internal Calls |
Column |
X |
||
Last Occurrence |
This refers to the time of the last occurrence of peak concurrent calls. |
Column |
X |
X |
|
Other Calls |
Displays the number of Other Calls |
Column |
X |
||
Out-Blocked (Equipment Failure) |
The total number of blocked calls at the busy hour due to equipment failure. Displays only for PBXs that provide information on blocked calls. |
Column |
X |
||
Out-Blocked (No Trunks) |
The total number of blocked calls at the busy hour due to trunks not being available. Displays only for PBXs that provide information on blocked calls. |
Column |
X |
||
Outbound Calls |
Contains the number of outbound calls |
Column |
X |
||
Peak Busy Hour |
Displays the hour of day in which the most calls occurred at the same time. It can display the hour in Local or GMT time and is shown in 24-hour notation, 00:00 - 23:00. |
Column |
X |
X |
X |
Peak Concurrent Calls |
Displays the highest number of calls that occurred at the same time for the given time period. |
Column |
X |
X |
|
Peak Duration |
Displays the greatest amount of time for the peak concurrent calls event for the given time period. |
Column |
X |
X |
|
Peak Occurrences |
The number of peak concurrent call events for the given time period. |
Column |
X |
X |
|
Percent Capacity |
This determines how much of the available call volume is currently being used during the peak busy hour. The percent capacity is based upon the total duration of calls divided by the total capacity of the system for a given time period. It can be modified to display the Average by Date or Average by Hour. |
Column |
X |
||
Total Bandwidth |
The total amount of bandwidth required to accommodate the call traffic volume. It is the calculated sum of the bandwidth plus the additional overhead. |
Column |
X |
||
Trunk Group |
The Trunk or Gateway used by the call. |
Both |
X |
X |
X |
Trunk Overage/Deficit |
Displays the difference between the amount of trunks configured for the system and the amount of trunks needed based on call traffic. This is derived by subtracting the trunks optimal from trunks configured. |
Column |
X |
||
Trunks Configured |
The total number of trunks assigned for a particular facility. |
Column |
X |
X |
X |
Trunks Optimal |
This refers to the number of trunks required at the busy hour to cover the call volume based on the Erlang B calculation. The column can be displayed by total, average by date or average by hour. |
Column |
X |
||