A. Scenario: T1 to SIP Conversion
A corporation currently uses T1 lines and will be converting to a SIP environment. The corporation will need to estimate the bandwidth needed for the conversion.
Solution:
A bandwidth analysis report will be run to determine the highest number of calls that occurred at the same time and the amount of bandwidth required for the conversion. The time frame should be at least one month to provide enough data to make an informed decision.
Steps:
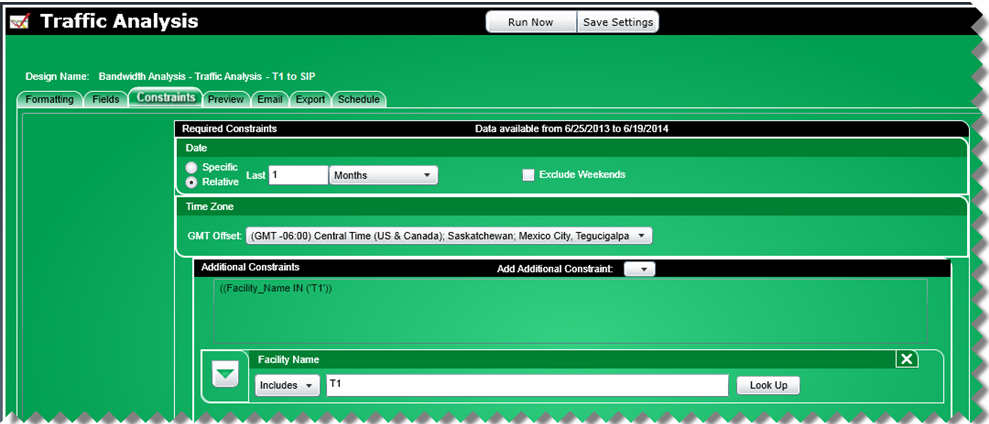
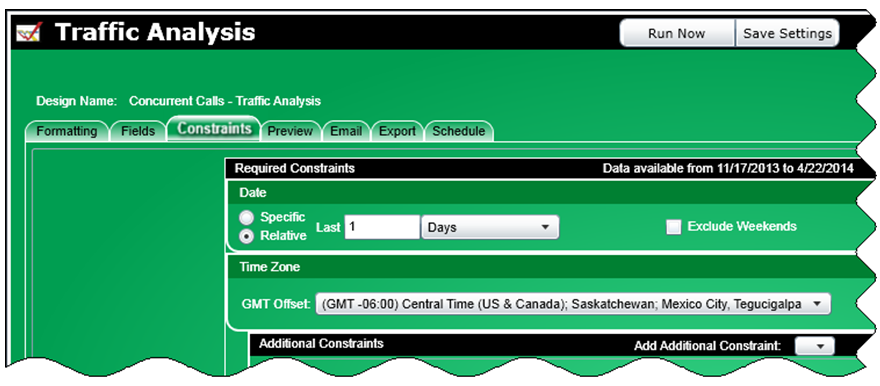
1 Using the Bandwidth Analysis – Traffic Analysis template, on the Constraints tab, set the date range by choosing Relative and last 1 month. Add a constraint for Facility Name (from the Add Additional Constraints menu) and choose the facility to be converted to SIP.
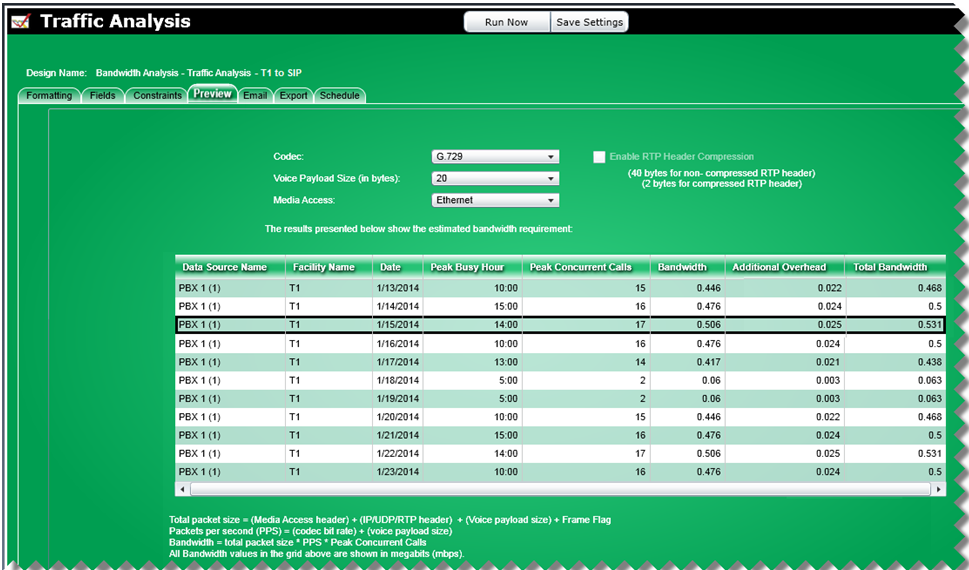
2 Click on the Preview tab to view the results on-screen.
3 Click the Run Now button to create a report. After the individual lines for each day are printed, there will be information titled “Highest Peak in Period” that will show the first time the greatest amount of peak concurrent calls was reached and the greatest amount of bandwidth required for that level of call traffic.
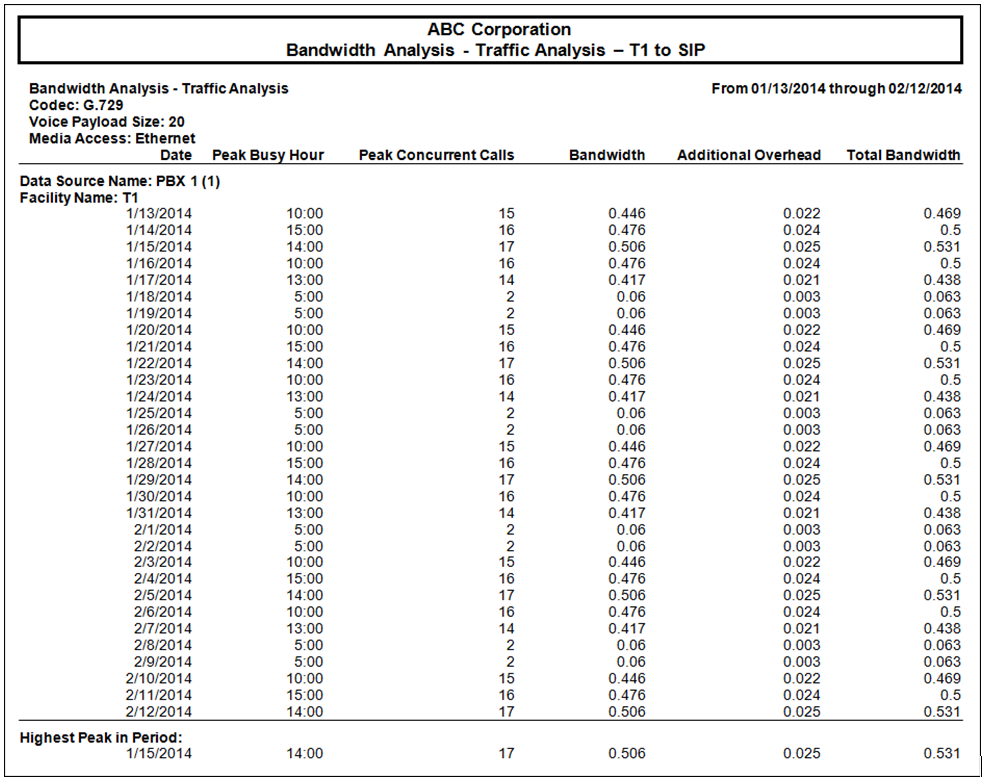
4 Note the highest number of Peak Concurrent Calls and bandwidth for the month.
Conclusion: For the example report shown above the highest number of Peak Concurrent Calls for the month was 17 which indicates that at least 17 concurrent call paths and a total bandwidth of 0.531 are required to accommodate the current call traffic load.
B. Scenario: Consolidation to Centralized SIP
A corporation currently has offices in Boston, Dallas, and Chicago and each has one or more Individual T1’s. The goal is to move all traffic on-net to a centralized data center with centralized SIP trunking.
Solution:
There are three parts to the solution; determine how many SIP trunks are needed, determine the additional bandwidth needed on the centralized data point, and determine the savings to be realized once the consolidation is completed.
Part 1 of 3:
Determine how many SIP trunks are needed:
Steps:
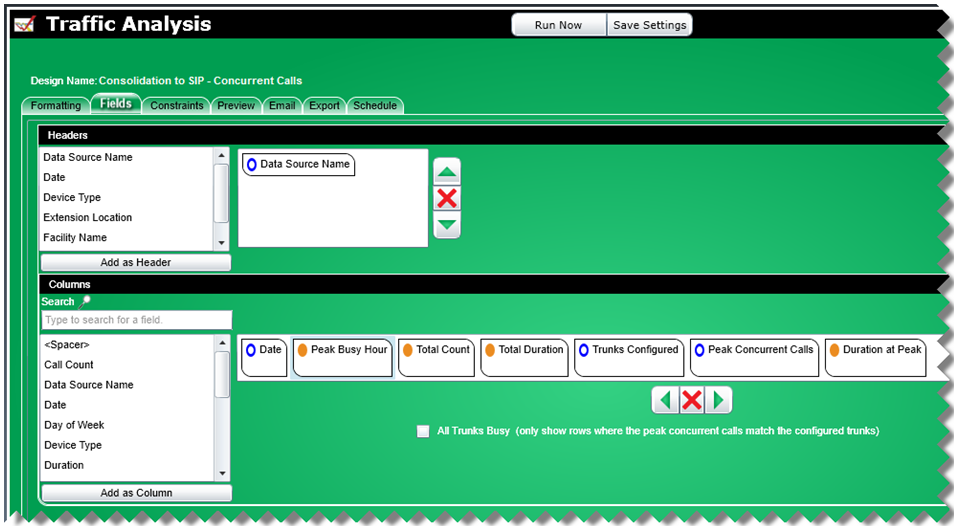
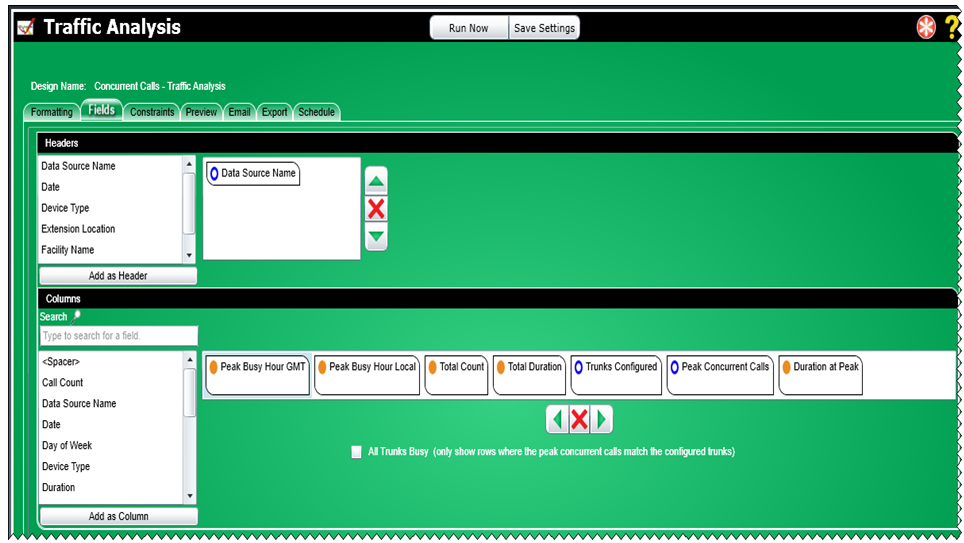
1 Using the Concurrent Calls – Traffic Analysis template, on the Fields tab, remove the Facility Name field from the Headers section so the call traffic information for all the included facilities will be summarized together. Also remove the Trunks Configured column as it is not needed based on the summarization. .
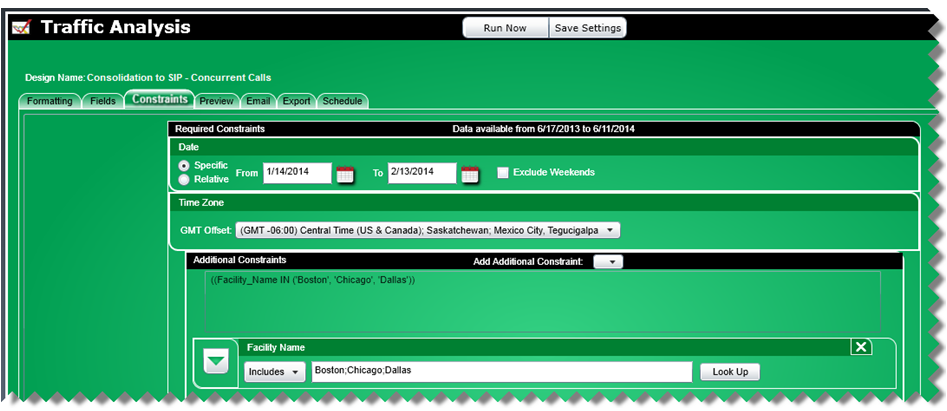
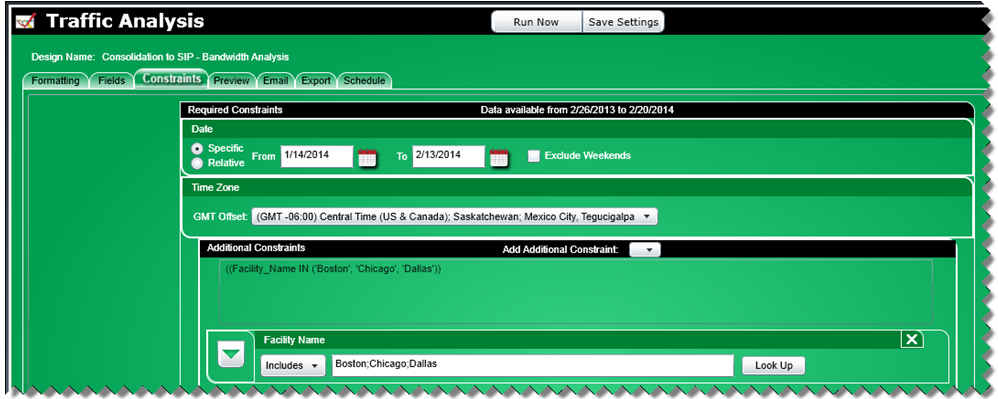
2 On the Constraints tab, set the date range by choosing “Specific” and entering the start (from) and end (to) dates. Add a constraint for Facility Name (from the Add Additional Constraints menu) and choose the facilities to be converted to SIP.
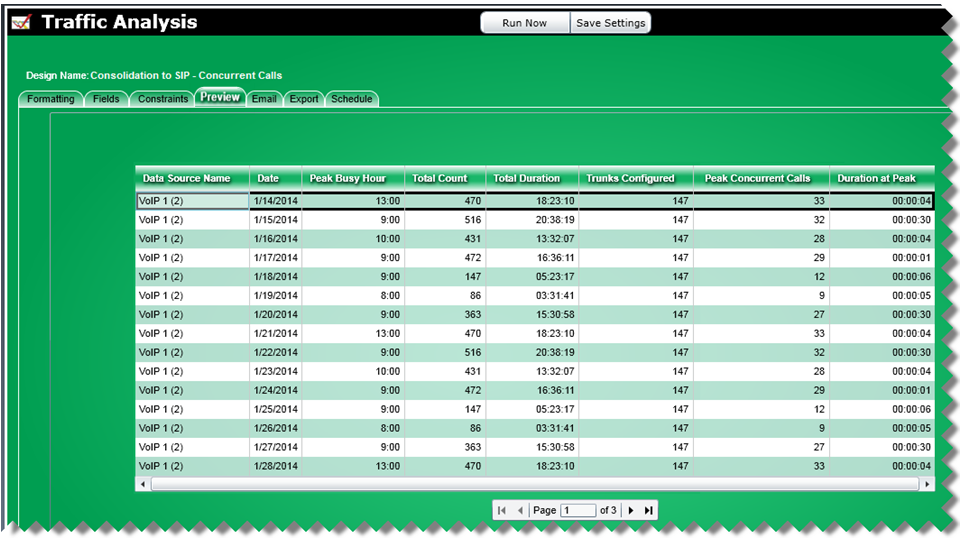
3 Click on the Preview tab to view the results on-screen. The highest number of Peak Concurrent Calls for the given date range is the number for which you are searching.
4 Click the Run Now button to create a report. After the individual lines for each day are printed, there will be information titled “Highest Peak in Period” that will show the first time the greatest amount of peak concurrent calls was reached. In the example, the highest peak in period occurred on 1/14/14.
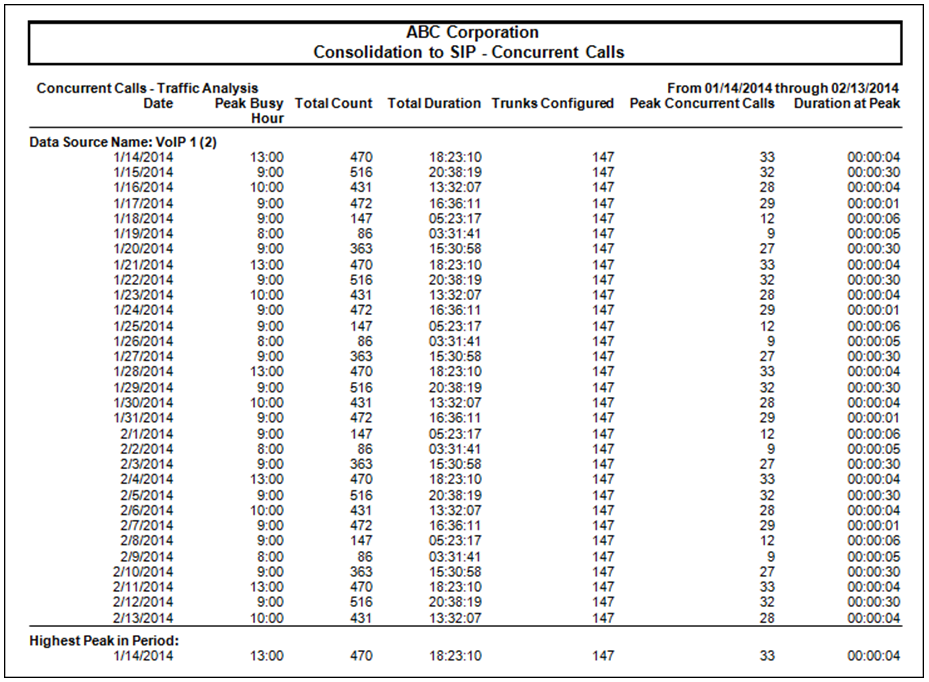
Part 1 Conclusion: For the example report shown above the highest number of Peak Concurrent Calls for the month was 33 which indicates that at least 33 SIP trunks are required to accommodate the current call traffic load.
Part 2 of 3:
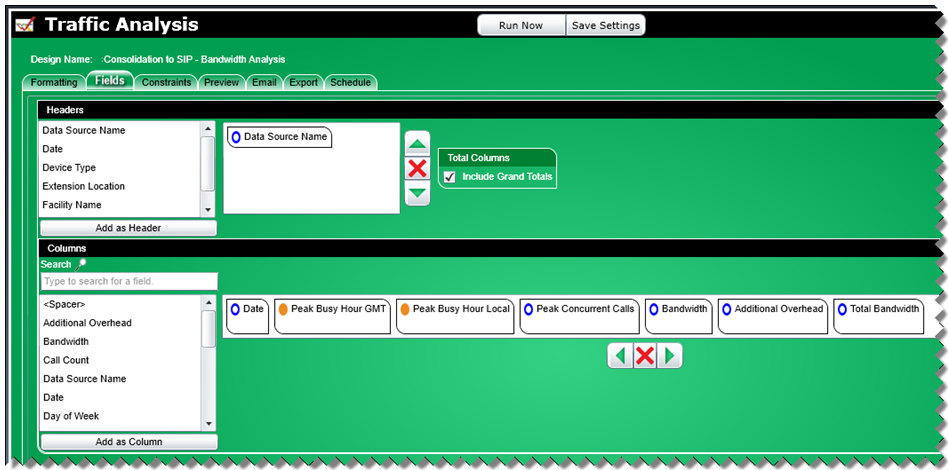
Determine how much additional bandwidth will be needed to carry all this traffic on-net to the centralized data point. The assumption is that the data center IS NOT at any of the three office locations. Thus, all traffic will be routed on your MPLS network to a centralized place.1 Using the Bandwidth Analysis – Traffic Analysis template, on the Fields tab, remove the Facility Name field from the Headers section so the call traffic information for all the included facilities will be summarized together.
2 On the Constraints tab, set the date range by choosing “Specific” and entering the start (from) and end (to) dates specifying the same date range as was used in Part 1 of 3 from above. Add a constraint for Facility Name (from the Add Additional Constraints menu) and choose the facilities to be converted to SIP.
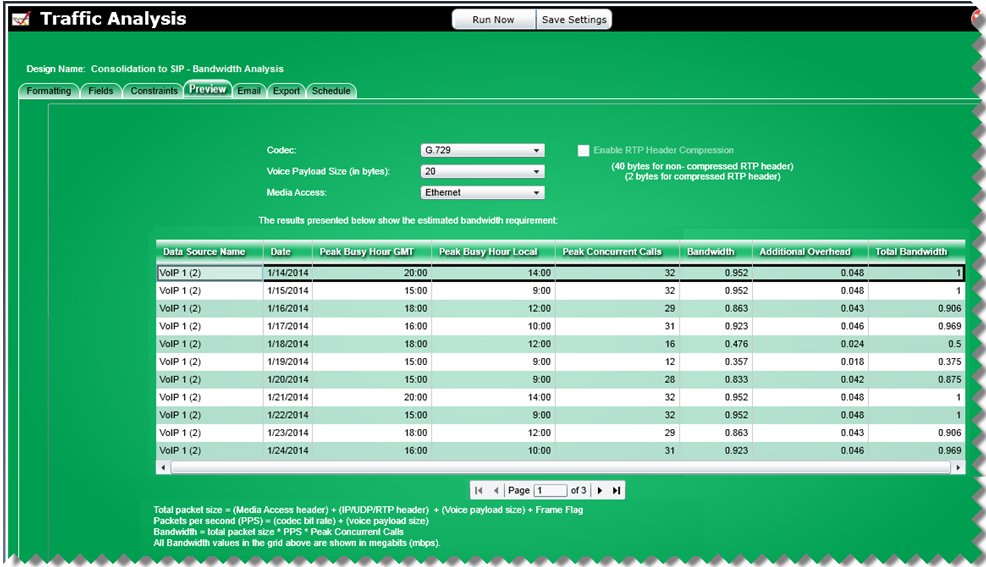
3 Click on the Preview tab to view the results on-screen. The highest amount of bandwidth within the given date range is the number for which you are searching. In the example, the highest bandwidth required occurred on 1/14/14.
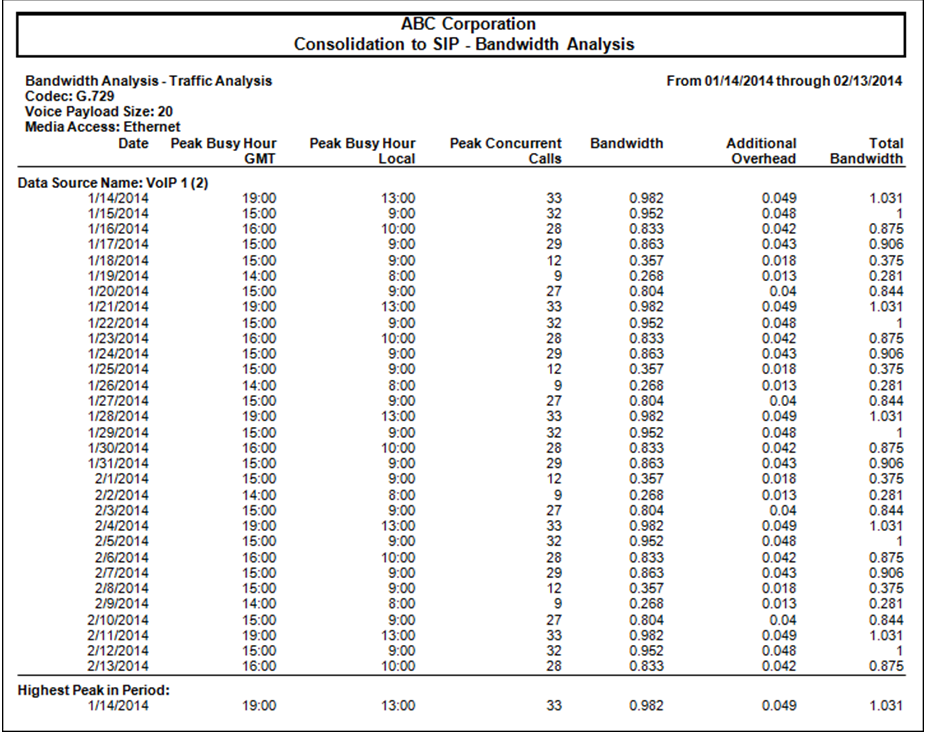
4 Click the Run Now button to create a report. After the individual lines for each day are printed, there will be information titled “Highest Peak in Period” that will show the greatest amount of bandwidth required.
Note: The bandwidth numbers change when you select a different codec, for example from G.729 to G.711. As voice quality goes up, bandwidth goes up.
Part 2 Conclusion: For the example report shown above the greatest amount of bandwidth required for the month was a total of 1.031 mbps to accommodate the current call traffic load.
Part 3 of 3:
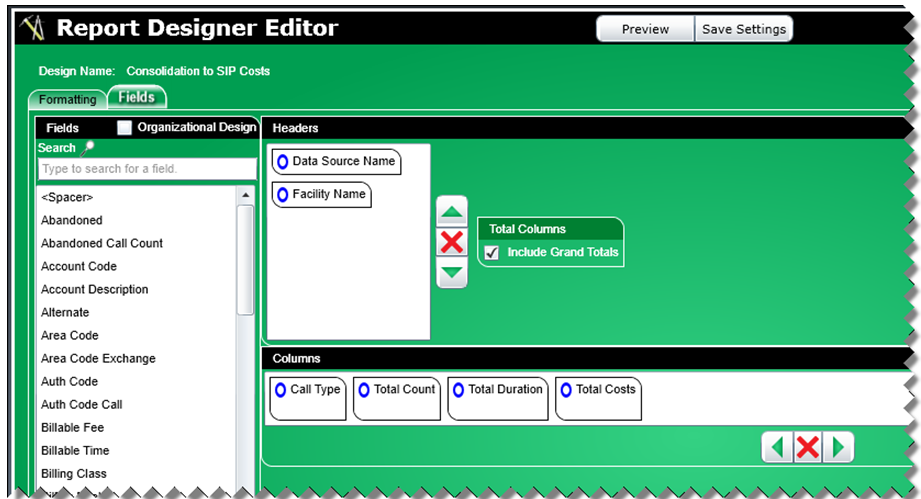
Determine how much you are currently paying to carry that traffic with the current network. The scenario is that you are currently paying for all local and LD calls. Under SIP, the non-international calling is included.1 Create a facility summary report in Report Designer to show the total count, duration, and cost. Include Data Source Name and Facility Name because we want totals at both levels.
2 In Report Publisher using the created report, choose the same date range as previously. On the Additional Constraints tab, choose the same facilities.
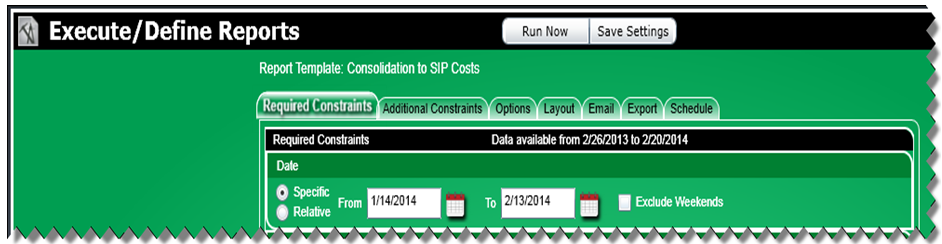
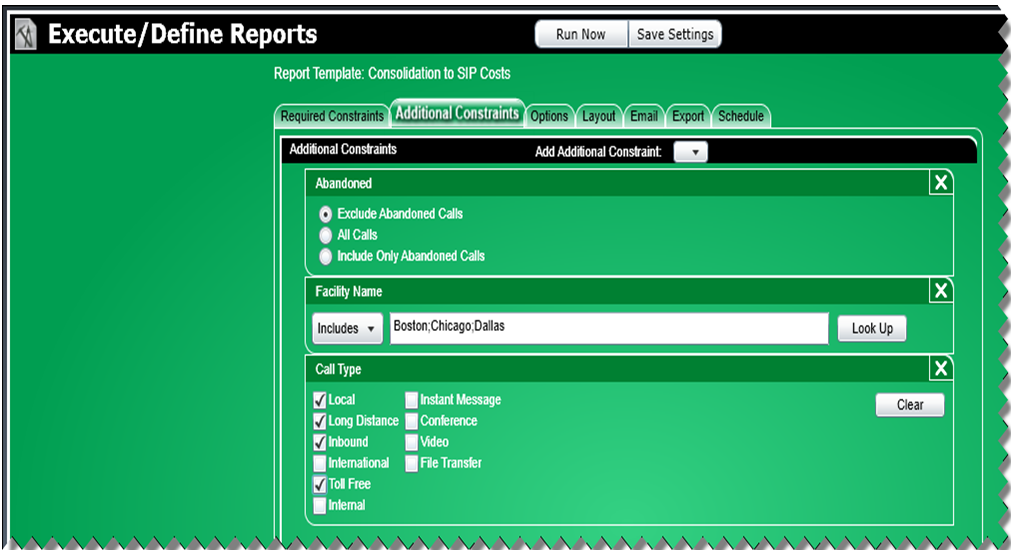
3 On the Additional Constraints tab, add a constraint for Facility Name and choose the facilities to be converted to SIP. Also, add a constraint for Call Type and choose Local, Long Distance, Inbound, and Toll Free because these are calls that incur charges with the current network. These calls will be included once converted to SIP so the current costs will be saved.
4 Click the Run Now button to create a report.
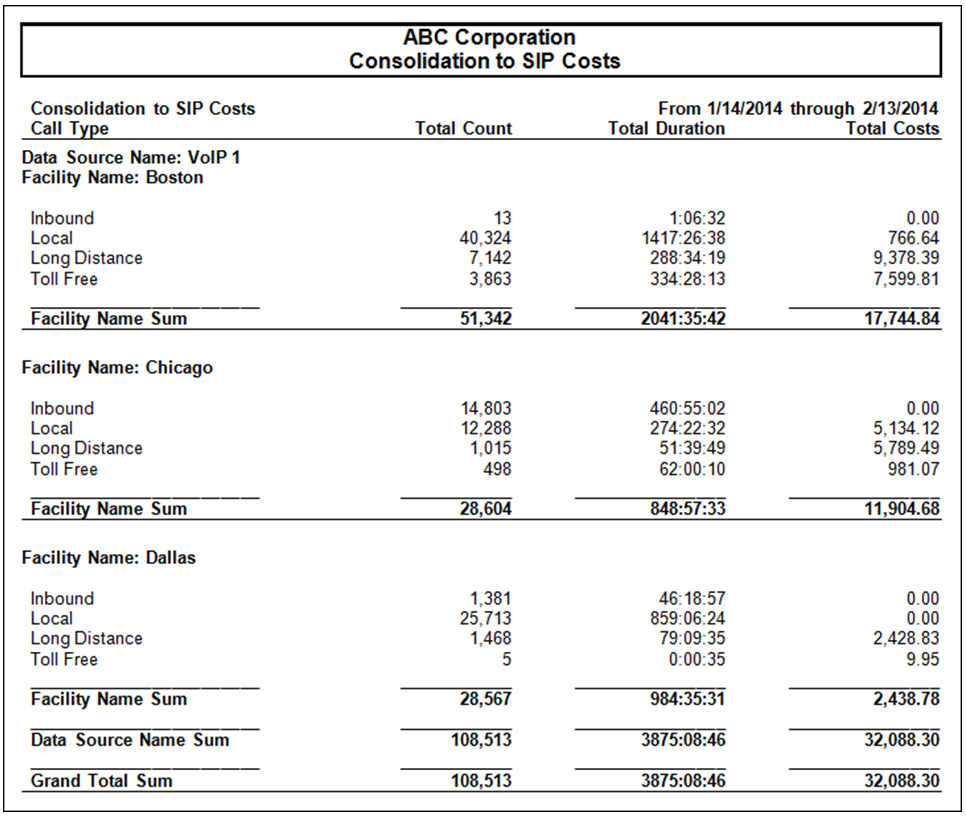
5 The example report shown above specifies the total call cost for each facility as well as the combined total call cost of $32,088.30 for all three facilities.
Part 3 Conclusion: Since Inbound, Local, Long Distance, and Toll Free calls are included with SIP there will be no cost for these calls once all on-net traffic is consolidated to a centralized data center with centralized SIP trunking., therefore, the entire current call cost will result in savings of $32,088.30.
Note: The report illustrates savings based upon a one month scenario.
C. Scenario: On-Net Calling Bandwidth Analysis
A corporation has implemented VoIP. The company has a cluster in the US and a cluster in the UK. Inter-office calling takes place on-net. The company must determine how much bandwidth is needed at peak to carry the traffic.
Solution:
There are two parts to the solution; determine the bandwidth needed for inter-location calls within the same cluster and determine the bandwidth needed for the calls between clusters.
Part 1 of 2:
Run a Bandwidth analysis of the calls between locations but not in the same office for each cluster.
Steps:
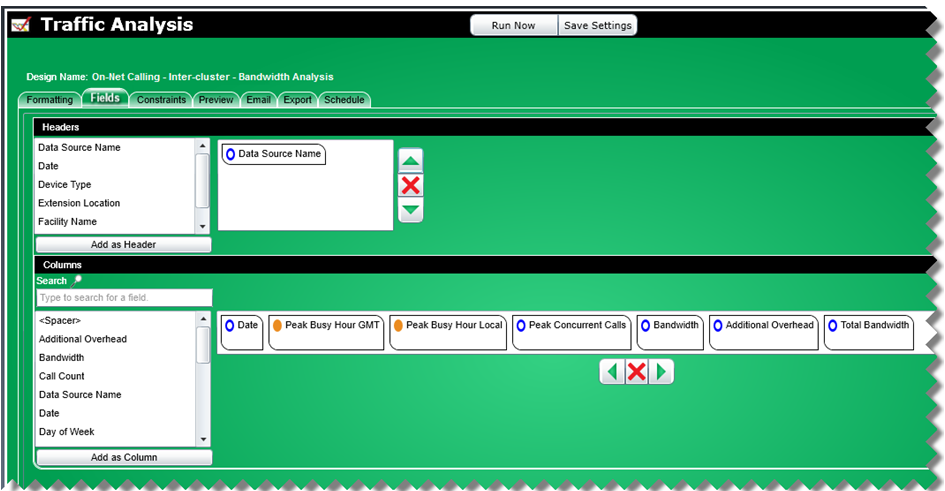
1 Using the Bandwidth Analysis – Traffic Analysis template, on the Fields tab, remove the Facility Name field from the Headers section so the call traffic information for all the facilities will be summarized together.
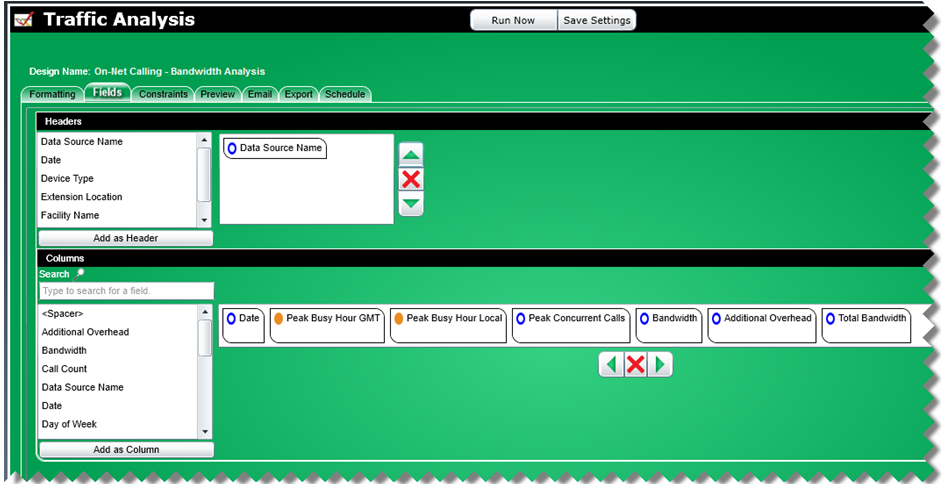
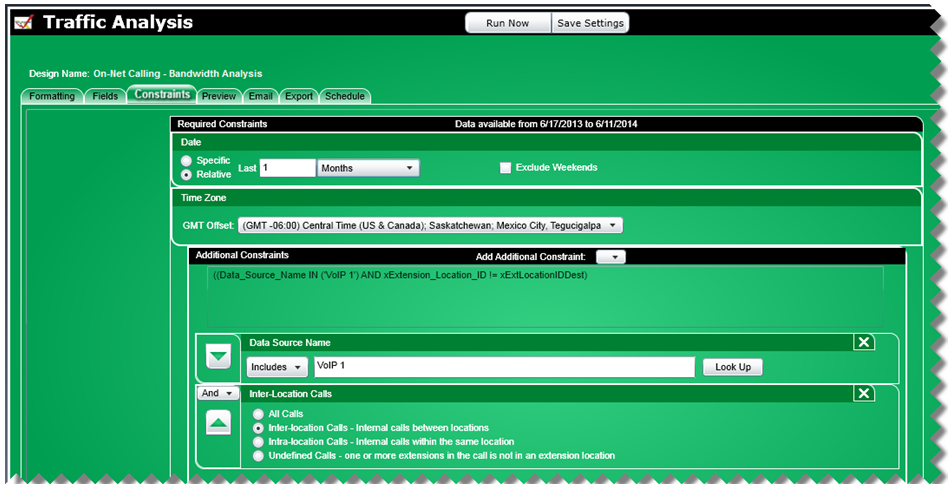
2 On the Constraints tab, set the date range by choosing Relative and last 1 month. Add a constraint for Data Source Name (from the Add Additional Constraints menu) and a constraint for Inter-location calls choosing “Inter-location Calls – Internal calls between locations”. This example shows the constraints for the US cluster only. A separate report should be run for the UK cluster.
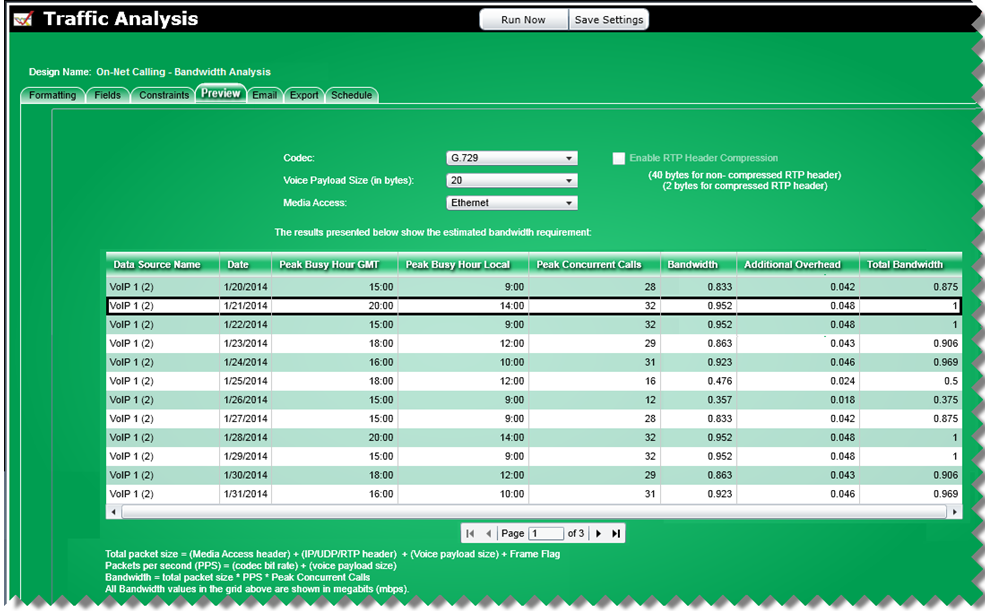
3 Click on the Preview tab to view the results on-screen.
4 Click the Run Now button to create a report. After the individual lines for each day are printed, there will be information titled “Highest Peak in Period” that will show the greatest amount of bandwidth required.
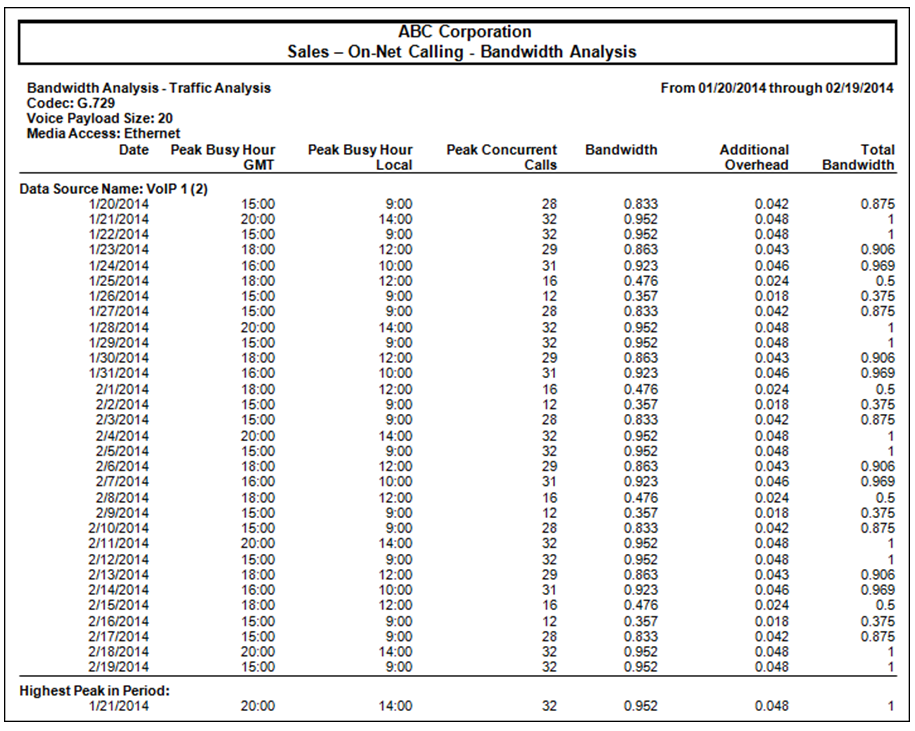
Part 1 Conclusion: For the example report shown above, the greatest amount of bandwidth required for the month was a total of 1 mbps to accommodate the current call traffic load.
Part 2 of 2: Run a Bandwidth analysis of the internal calls between clusters to determine the bandwidth requirements.
Steps
1 Using the Bandwidth Analysis – Traffic Analysis template, on the Fields tab, remove the Facility Name field from the Headers section so the call traffic information for all the facilities will be summarized together.
2 On the Constraints tab, set the date range by choosing Relative and last 1 month. Add a constraint for Facility Name and choose the Inter-cluster facility.
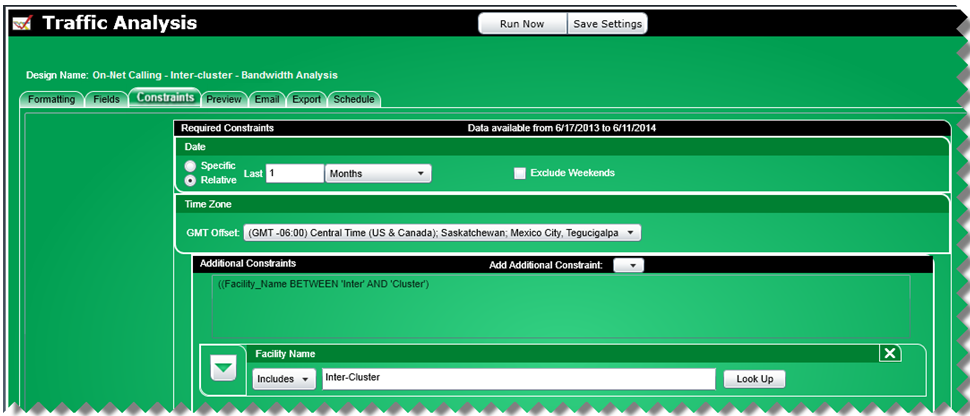
3 Click on the Preview tab to view the results on-screen.
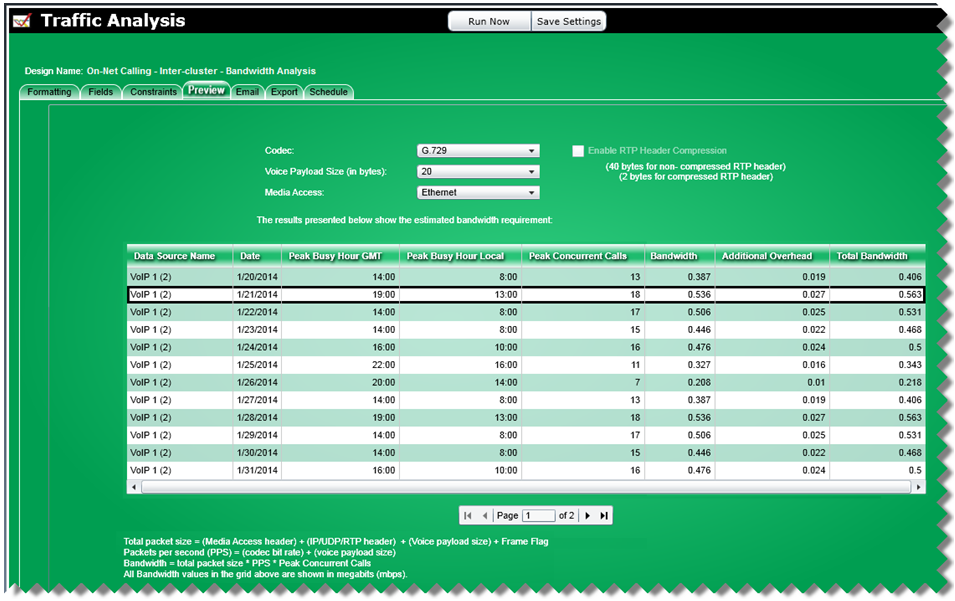
4 Click the Run Now button to create a report. After the individual lines for each day are printed, there will be information titled “Highest Peak in Period” that will show the greatest amount bandwidth required.
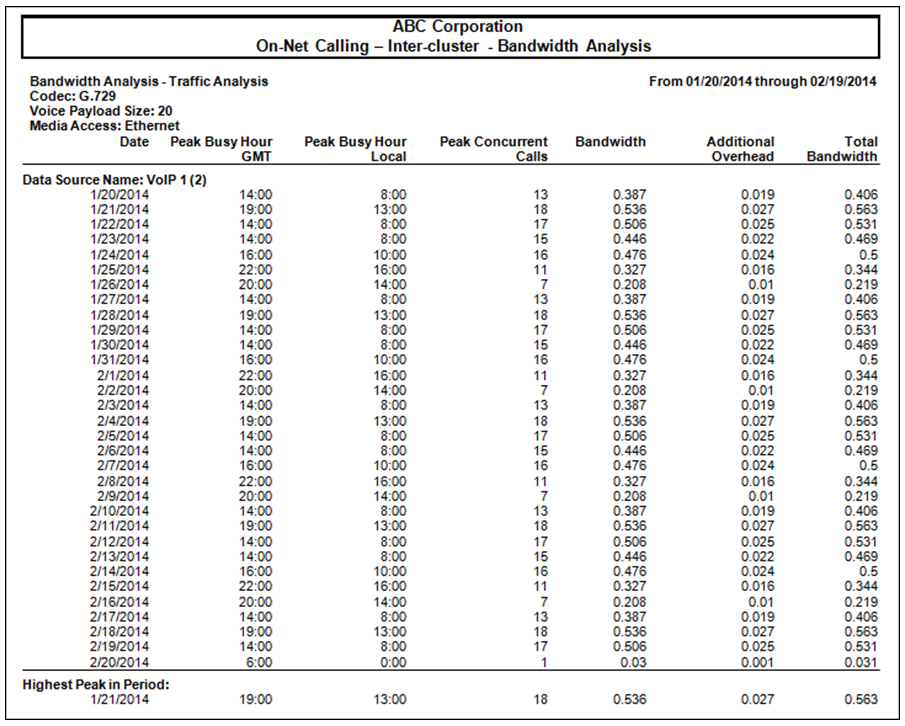
Part 2 of 2 Conclusion: For the example report shown above, the greatest amount of bandwidth required for the month was a total of 0.563 mbps to accommodate the current call traffic load between clusters.
D: Scenario: Standard Erlang Analysis
For various reasons, certain offices are not moving to SIP or on-net calling. They use PRI’s and want to monitor their trunk usage on a weekly basis to ensure their network is right-sized for their call traffic.
Solution:
Create an Erlang B report that will run weekly and will include the trunks configured and the trunks optimal for each facility in their network.
Steps:
1 Using the Erlang B – Traffic Analysis template, on the Constraints tab, set the date range by choosing Relative and last 1 week.
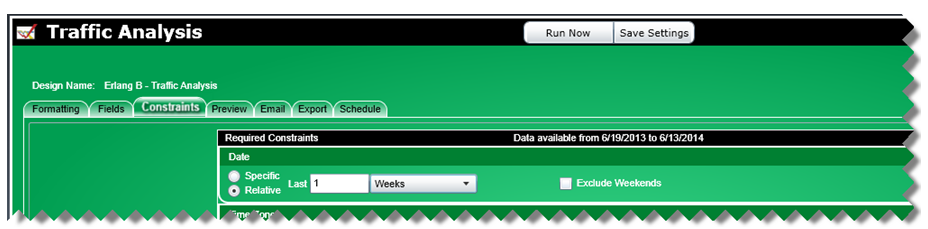
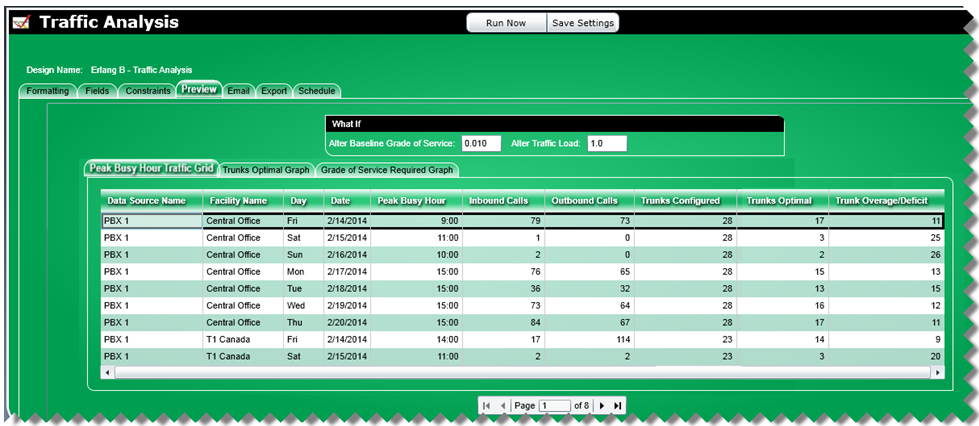
2 Click on the Preview tab to view the results on-screen.
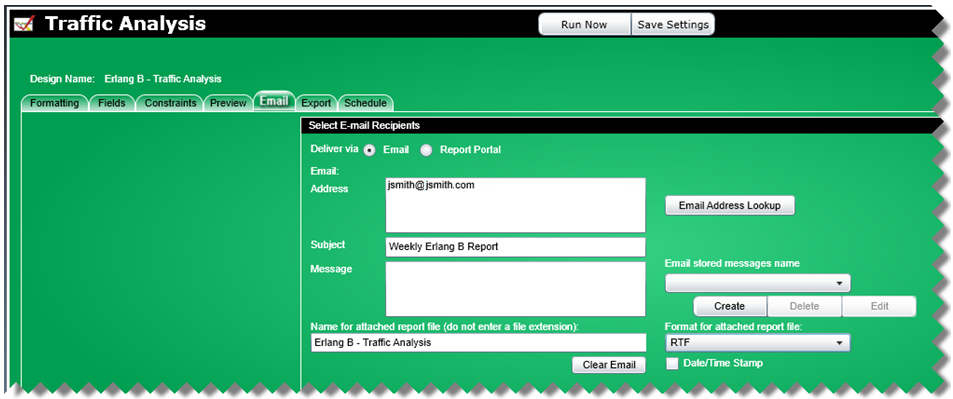
3 In order to automatically receive a weekly report via email, the email address(es) to receive the reports are added on the Email tab.
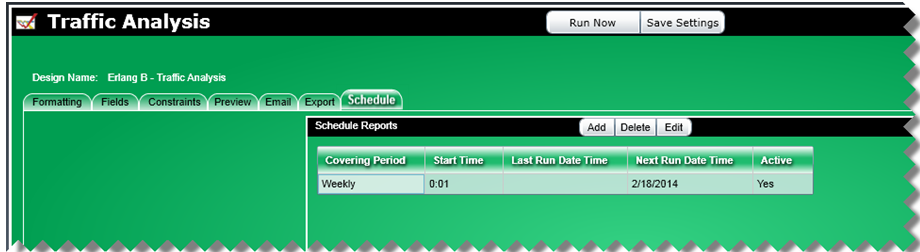
4 On the Schedule tab, set up a weekly schedule for creating and sending the reports.
5 Following is an example of the report received via email from the Erlang B template.
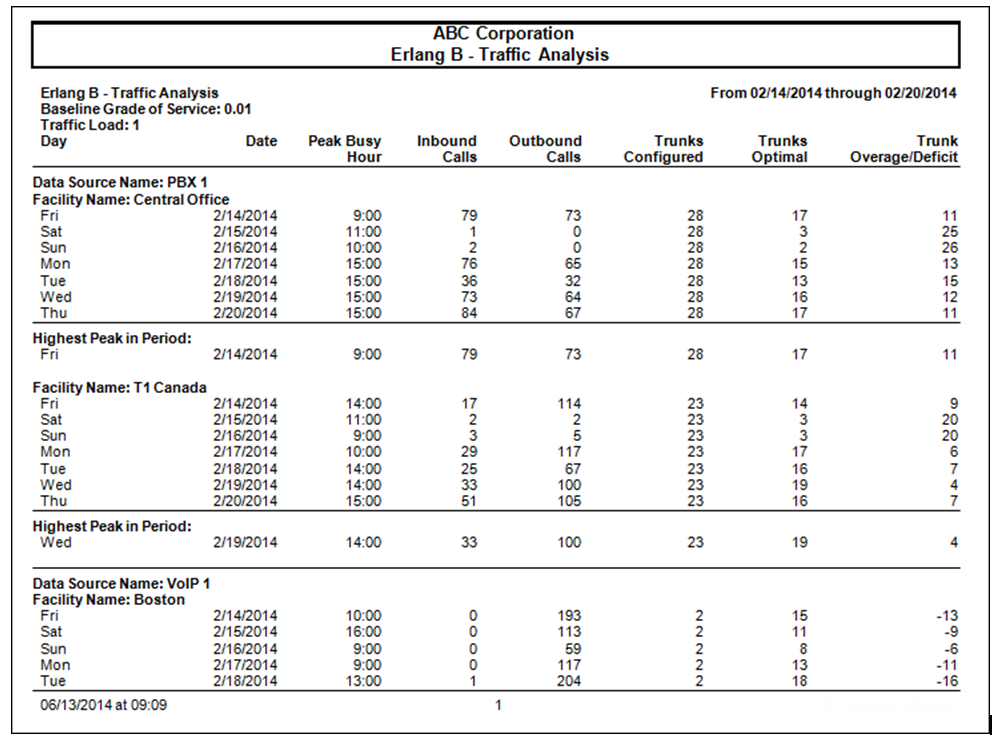
Conclusion: In creating a weekly scheduled Erlang B report, appropriate personnel will receive the information to monitor their trunk usage on a continual basis. As shown above, some facilities were over-trunked. Other facilities show a negative number which may indicate that the trunk configuration is incorrect and should be a trigger to run a comprehensive call and trunk report for the given time range to further research the cause of the given under-trunking.
E: Scenario: All Trunks Busy
A company needs to know how often, when, and for how long they run out of capacity to make or receive calls so they want to monitor this information on a weekly basis to ensure their network is right-sized for their call traffic.
Solution:
Create a Concurrent Calls – All Trunks Busy configuration that will run weekly, place the report in a secure location, and notify the proper people via email when the weekly report is available.
Steps:
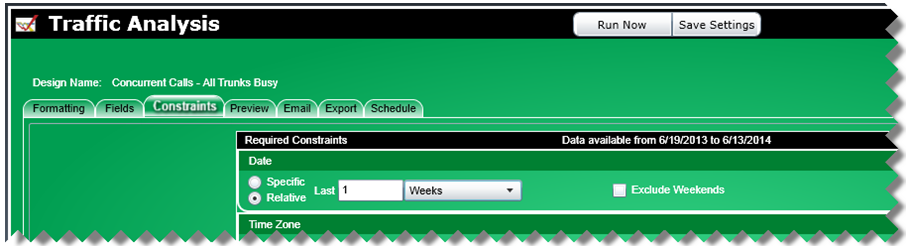
1 Using the Concurrent Calls – All Trunks Busy template, on the Constraints tab, set the date range by choosing Relative and last 1 week.
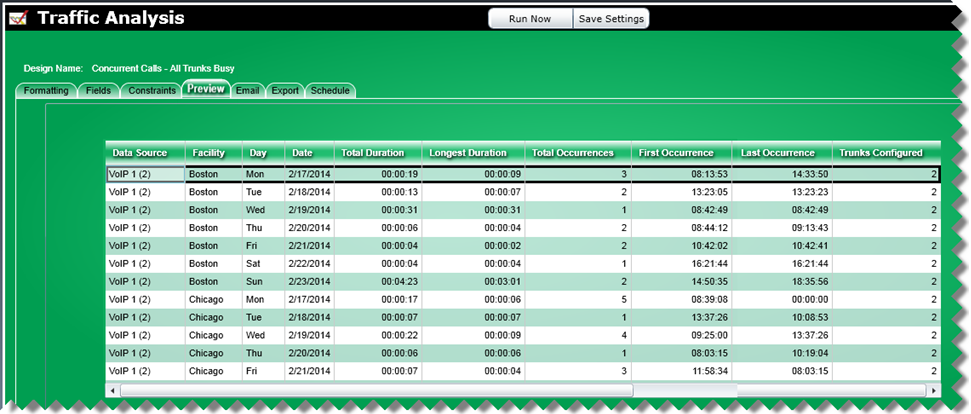
2 Click on the Preview tab to view the results on-screen.
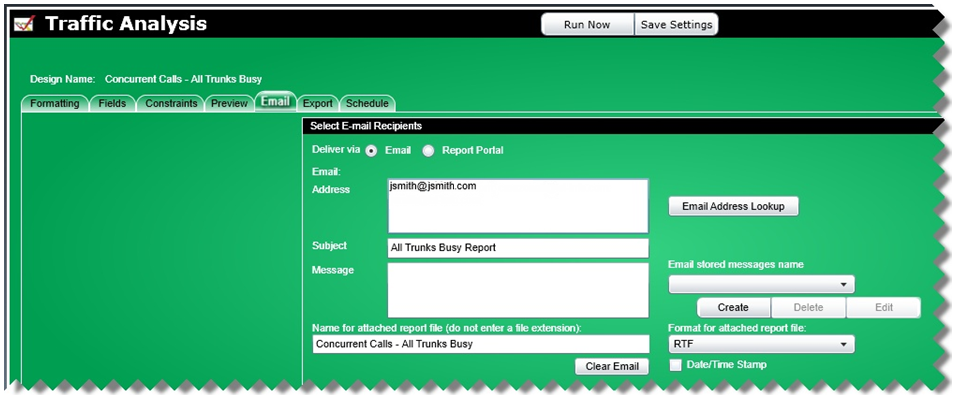
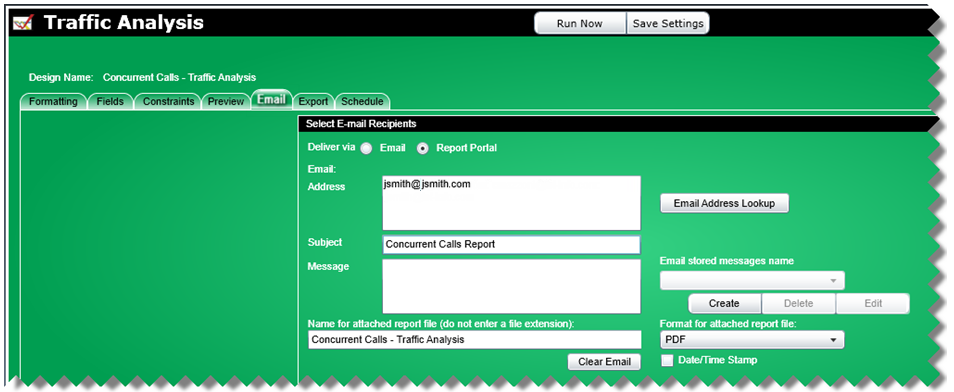
3 In order to create a weekly report and notify people via email when the report is ready, the email address (es) to receive the notification are added on the Email tab. Choose Report Portal to store the report in a user-defined location.
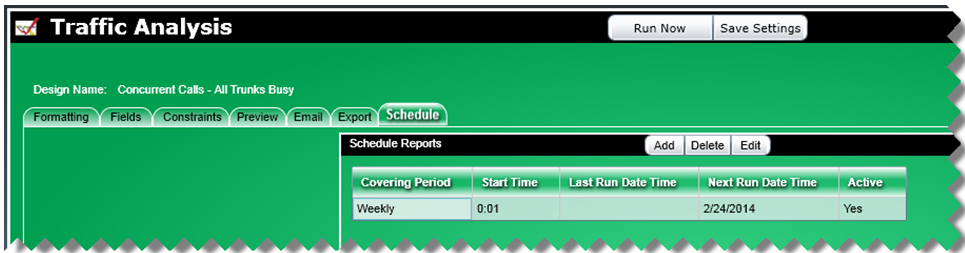
4 On the Schedule tab, set up a weekly schedule for creating and sending the reports.
5 Following is an example of the report created.
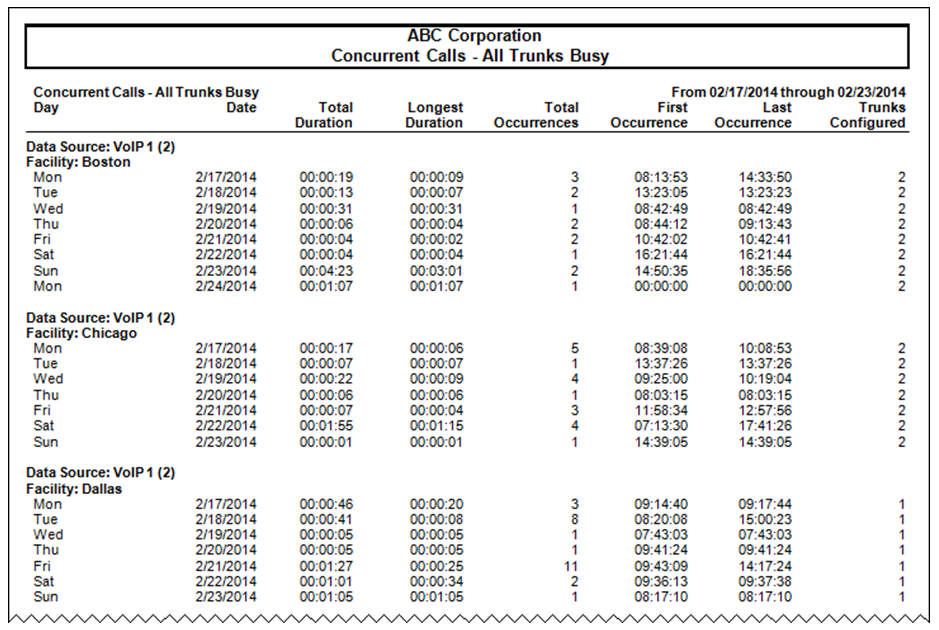
Conclusion: In creating a Concurrent Calls – All Trunks Busy report that runs on a weekly basis, reports are sent via email allowing managers to monitor their call capacity limitations and make appropriate decisions about trunking. As shown above, there were numerous all trunks busy events that would prevent further calls from being placed or received during those times.
F: Scenario: Concurrent Calls – Traffic Analysis
A company is planning a move to a new location and will be setting up a new network. They require summary reports showing the single busiest hour of call traffic so they can size the number of trunks correctly. For the busiest hour, they need both the count on peak concurrent calls and the duration at peak. They want two reports; one for all outbound toll free calls on each cluster and the other for all outbound calls to a specific phone number. The report must include data for the time period December 1, 2013 – Today excluding weekends.
Solution:
Create a Concurrent Calls – Traffic Analysis custom report that will place the report in a secure location and notify the proper people via email when the report is available.
Steps for the first report:
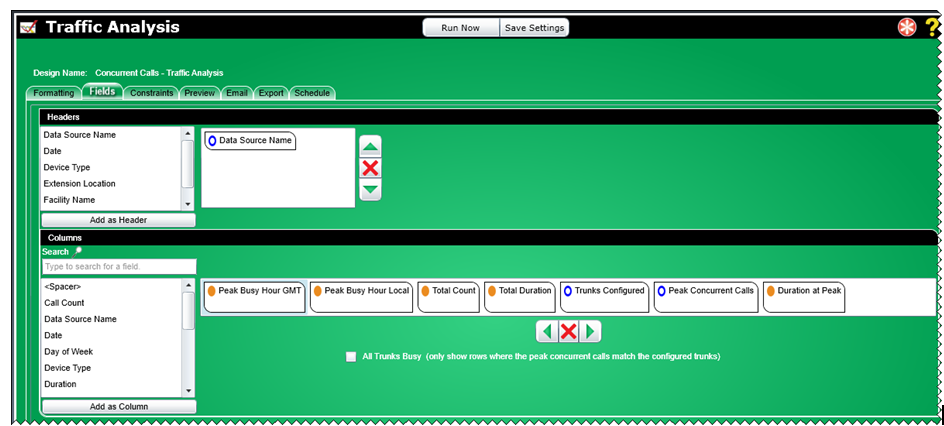
1 Using the Concurrent Calls – Traffic Analysis template, on the Fields tab, remove the Facility Name from the Headers section.
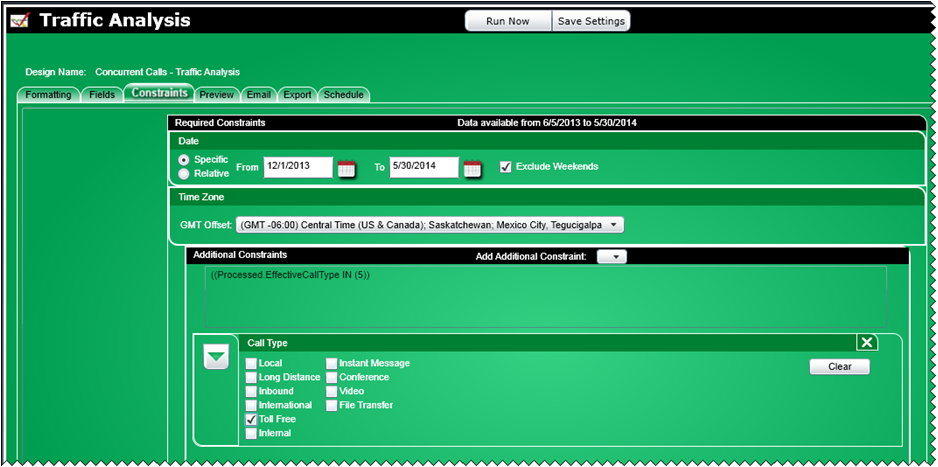
2 On the Constraints tab: Set the date range by choosing Specific, set the From date to December 1, 2013 and the To date to today’s date. Check the option to exclude weekends.
3 On the Email tab, select Report Portal to save the report in a secure location and notify each of the email recipients once the report has been created.
4 Following is an example of the report created.
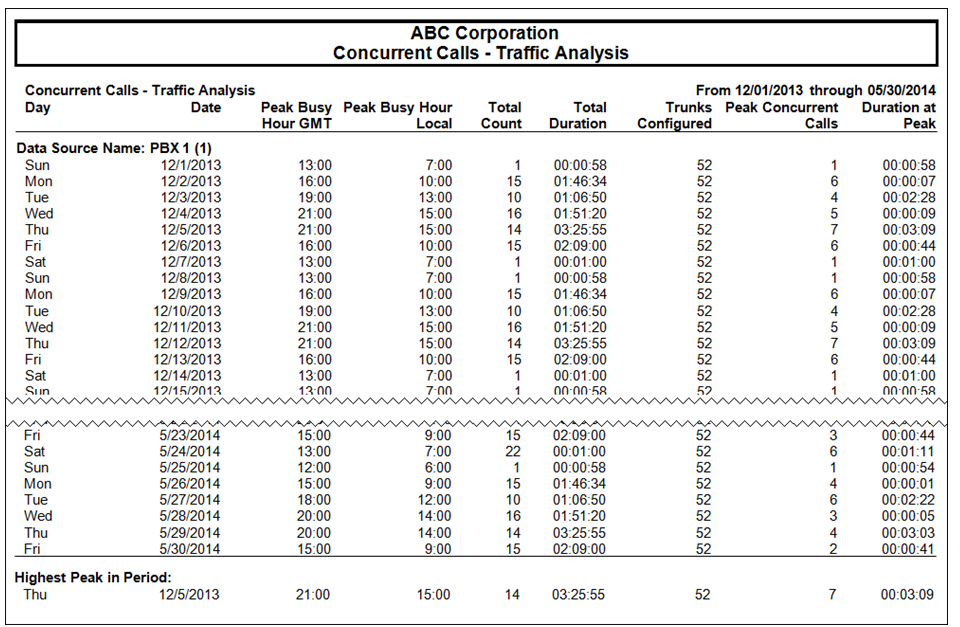
Note: The “Highest Peak in the Period” at the end of each Data Source section.
Steps for the second report:
1 For the second report, still using a Concurrent Calls – Traffic Analysis template, on the Fields tab, remove the Facility Name from the Headers section.
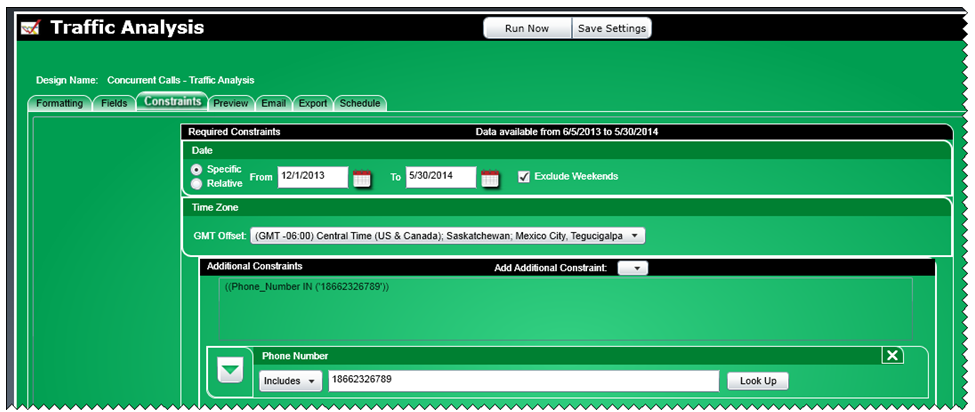
2 On the Constraints tab: Set the date range by choosing Specific, set the From date to December 1, 2013 and the To date to today’s date. Check the option to exclude weekends.
a. Set the date range by choosing Specific, set the From date to December 1, 2013 and the To date to today’s date. Check the option to exclude weekends.
b. Add a Phone Number constraint specifying the number.
3 Following is an example of the report created.
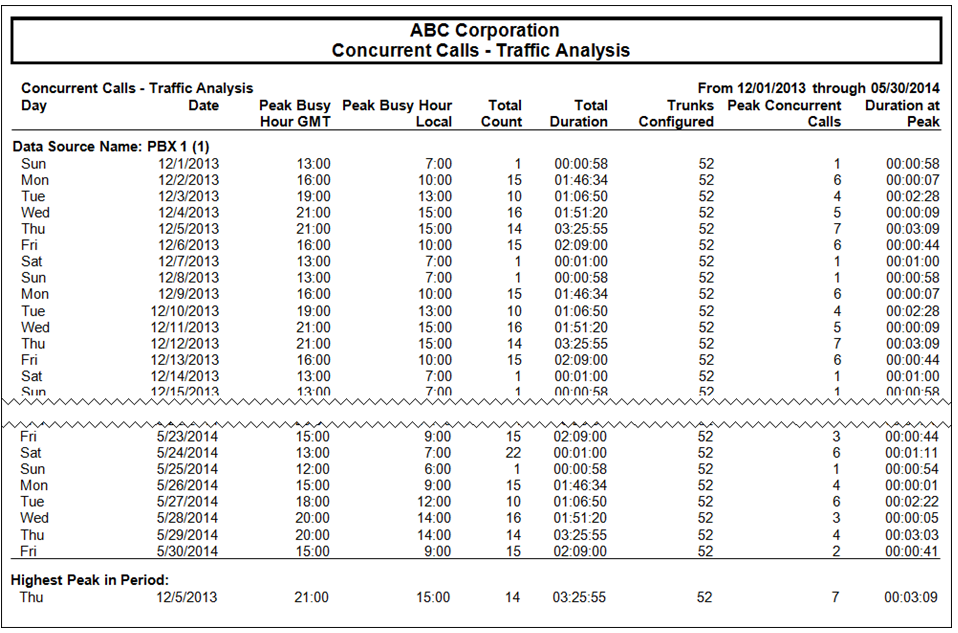
Note: The “Highest Peak in the Period” at the end of each Data Source section.
Conclusion: In creating Concurrent Calls – All Trunks Busy reports provides the company with information on the greatest number of calls that occurred at the same time. This information may then be used to right-size the new network.
 Back
to top.
Back
to top.General Template Information
All Traffic Analysis templates by default include internal calls.
The peak busy hour may be shown in local or GMT time. Local time is the GMT offset chosen in the Time Zone section on the Constraints tab. So, for example, if Central time zone was chosen on the Constraints tab and a call occurred at 08:15, the local time would show 08:15 and the GMT time would be 14:15 because the difference between Central and GMT time is 6 hours.
Erlang B
1 Erlang B is a modeling formula for calculating any one of the following three factors if you know or predict the other two:
Busy Hour Traffic (BHT): the number of hours of call traffic during the busiest hour of operation
Blocking (Grade of Service): the percentage of calls that are blocked because not enough lines are available
Lines: the number of lines in a trunk group.
2 Busy Hour Traffic represents the quantity of traffic expressed in a unit called Erlangs.
Busy Hour Traffic = (average call duration (in seconds during the peak busy hour) * calls per hour / 3600) * traffic load factor (default is 1, may be set by the user)
3 An Erlang can be thought of as an hour’s worth of load capacity.
4 Grade of Service shows the probability of a call being blocked for a given traffic load for a specific number of available trunks. This field may be altered in the What If section under the Preview tab. The default grade of service is 0.01 which indicates that the blocking probability is 1 in 100 calls.
5 Peak Busy Hour is the hour in which the highest duration of call traffic occurred.
6 Trunk Overage/Deficit is the difference between the configured trunks and the optimal trunks. A positive number indicates that the system currently has more trunks configured than is required based on the existing call traffic volume. A negative number indicates that more trunks are needed than is currently configured therefore they are under-trunked.
7 Trunks Optimal is a calculated field for Erlang B templates and new reports that shows the number of trunks required to handle the current call traffic. It is derived based on peak busy hour call volume, duration, and desired grade of service.
8 Traffic Load is used as a multiplier to perform “what if” calculations. The default is 1. The Traffic Load may be modified by the user on the Preview tab in the What If section. For example, if you are planning to increase your call volume by 20%, you may change the Traffic Load to 1.2 which will cause a recalculation in the fields in the grid on the Preview tab to show new values for Trunks Optimal and Trunk Overage/Deficit.
9 An on-line Erlang B calculator can be found at http://www.erlang.com/calculator/.
Concurrent Calls
1 The Trunks Optimal field is not an option for Concurrent Calls because the amount of concurrent calls during the peak busy hour is equal to the number of trunks needed.
2 Peak Concurrent Calls is the greatest number of calls that occurred at the same time.
3 Peak Duration shows how long the peak concurrent calls occurred at the same time.
4 Peak Busy Hour for concurrent calls is the hour in which the highest number of calls occurred at the same time.
5 Since a peak concurrence of calls can occur multiple times during the given time period, the First and Last Occurrence fields provide the time of the first and last peak concurrent call event respectively.
Bandwidth Analysis
1 Bandwidth calculation:
For the following Media Access types use this formula for determining total packet size in bytes:
Media Types:
MPPP
Frame-Relay
HDLC
PPP
Ethernet
Formula:
Total packet size (in bytes) = (Media Access header) + (IP/UDP/RTP header) + (Voice payload size) + Frame Flag
For all other Media Access types or a Codec of “Other”, use the following formula for determining total packet size in bytes:
Total packet size (in bytes) = (Media Access header) + (IP/UDP/RTP header) + (Voice payload size) + Cell bytes wasted per voice frame
Total packet size (in bits) = Total packet size in bytes * 8 bits per byte
Voice payload size (in bits) = Voice payload size in bytes * 8 bits per byte
Packets per second (PPS) = (Codec bit rate) / (Voice payload size)
Bandwidth (in bits) = Total packet size * PPS * Peak Busy Hour Concurrent Calls
Convert the bandwidth in bits to megabits, 1 bit = 0.000000954 megabitsThe results are displayed in megabits with three decimal places.
Frame Flag, when used, will always be 1 byte.
2 Bandwidth information, codec information, and a bandwidth calculator may be accessed at the following site, however, a Cisco login and password are required to access the calculator.
http://tools.cisco.com/Support/VBC/do/CodecCalc1.do
3 The Additional Bandwidth field shows the calculated value of bandwidth times the multiplier specified by the user. The multiplier value can be changed on the Fields tab and is an option for the Additional Bandwidth field. The default multiplier is 5%.
4 The Total Bandwidth field is the sum of the calculated bandwidth plus the Additional Bandwidth.