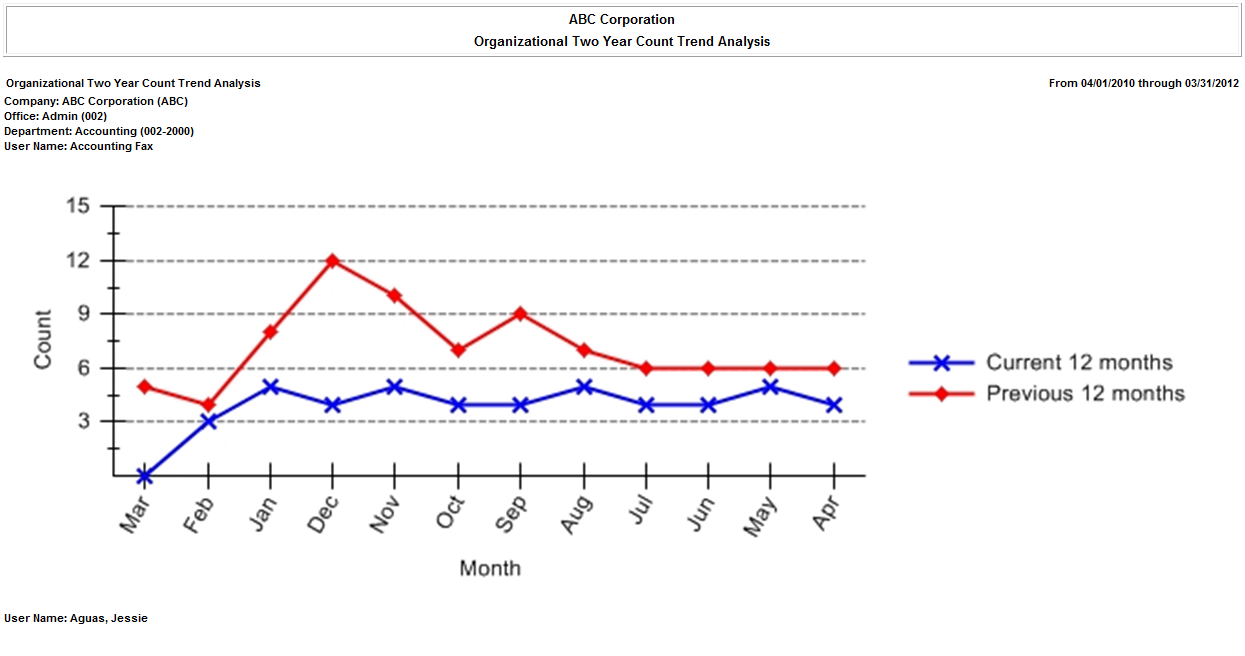
The Organizational Two Year Count Trend Analysis report contains line graphs that show you two years of call cost data so you can compare call costs on a month-by-month basis as well as call costs from one year to the next. Each organizational level is represented by a separate graph.
![]() Click to see the formatting options for the Organizational Two Year Count
Trend Analysis report.
Click to see the formatting options for the Organizational Two Year Count
Trend Analysis report.
![]() Click to see the report details for the Organizational Two Year Count
Trend Analysis report.
Click to see the report details for the Organizational Two Year Count
Trend Analysis report.
![]() Click to view a sample Organizational Two Year Count Trend Analysis report.
Click to view a sample Organizational Two Year Count Trend Analysis report.
![]()