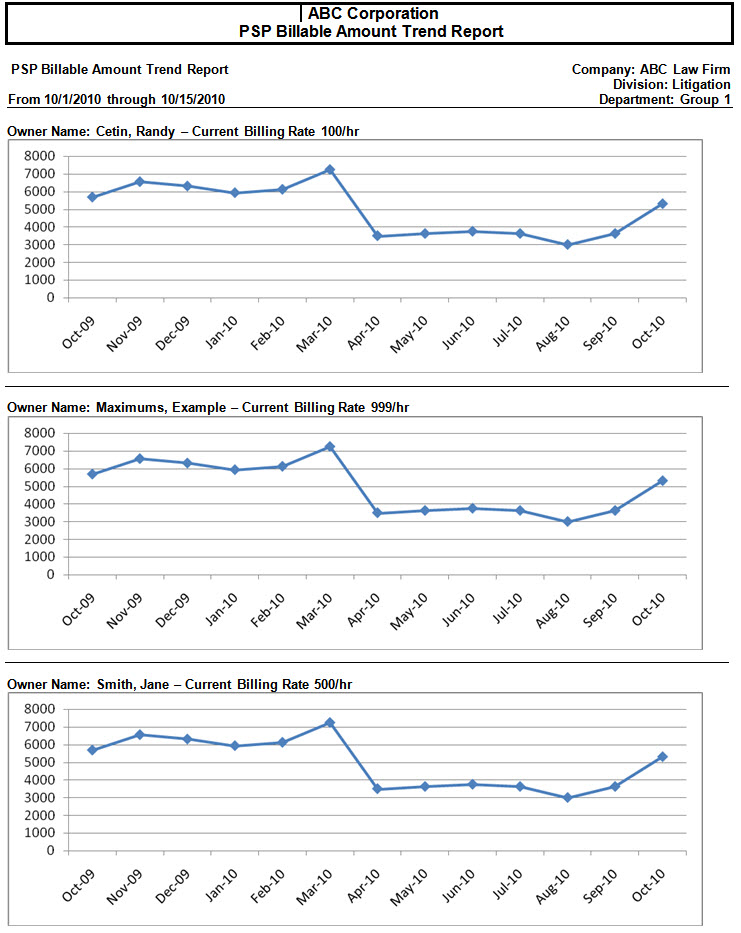
The PSP Billable Amount Trend report is generated as a line chart and is used to show the trend in billable hours over a selected period of time.
Click to see the formatting options for the PSP Billable Amount Trend report.
At the Required Constraints tab, specify the date and time settings for the report.
Note: You cannot a specific or relative date range greater than 24 months.
At the Additional Constraints tab, the default constraints for a PSP Billable Amount Trend report are:
Account Code
Billable Fee
Billable Time
Call Type
Company Code
Company Name
Cost Center Code
Cost Center Name
Data Source
Department Code
Department Name
Division Code
Division Name
Extension
Jurisdiction
Line Type
Matter Code
Owner Name
Phone Number
Phone Number Group
State
Summary Billable Fee
Summary Count
Click the Add Additional Constraints list box to include more constraints in your search criteria.
At the Options tab, the options available will not be the same from one report type to another. Only those options that apply to the selected report will appear. The option available with a PSP Billable Amount Trend report is:
Show report parameters on 1st page: If you select this check box, then a header page for a report will be created. This page displays the options selected, filters, and other settings that went into making up the report.
At the Layout tab, the following apply:
Page Breaks: With a PSP Billable Amount Trend report, there are no page break choices because the page break always occurs one level above the summary level chosen.
Summarization: The Summarize on this Level and Above list box contains a list of grouping levels. When you select a level, the report will summarize on that level and all levels above it. The level you choose collapses into a single summation line. The summarizing levels available with a PSP Billable Amount Trend report are:
Company
Division
Cost Center
Department
Owner Name
Click to see the details of the contents in a PSP Billable Amount Trend report.
The PSP Billable Amount Trend report contains one line graph for each summarization level chosen at the Layout tab. The line graph shows the trend for the billable amount for the time period specified at the Required Constraints tab.
The information in the graphs depends on the selection made from the Summarize on this Level and Above list box at the Layout tab.
When Owner is selected from the Summarize on this Level and Above list box, the report summarizes at the Department level
When Department is selected from the Summarize on this Level and Above list box, the report summarizes at the Cost Center level
When Cost Center is selected from the Summarize on this Level and Above list box, the report summarizes at the Division level
When Division is selected from the Summarize on this Level and Above list box, the report summarizes at the Company level
When Company is selected from the Summarize on this Level and Above list box, there is no summary graph
There is always a summary graph for the grand total regardless of the selection made from the Summarize on this Level and Above list box
Click to view a sample PSP Billable Amount Trend report.
